 NYMEX Gasoline
 NYMEX Heating Oil
Crude oil and products put in choppy declining price profiles for the week ended Feb 26, with RBOB and heating oil showing relatively more weakness than WTI. The ~8025 region represented consistent resistance for WTI, technical commentary indicates that a break above this level will see 8080 represent next resistance - a break of which could represent resumption of the recent bull run. That being said, the Percent R oscillator implies WTI is overbought.
The NYMEX natural gas parallel declining channel is well entrenched. This week saw a fall to the trend line support level which suggests a technical bounce may be seen next week. The end to winter demand; mediocre industrial demand and a strong supply outlook are not supportive of Henry Hub prices near-term.


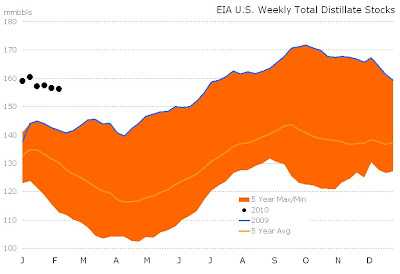
 EIA gasoline data were interpreted as bullish given the larger than expected inventory draw and the relatively large increase in demand. As a result, RBOB lead the crude complex higher, even though crude oil and distillate EIA data were not supportive; although, refinery rates were considerably higher. Crude oil has been moving in lock-step with equities; and higher on selective bullish fundamental news, while discounting neutral/bearish near-term supply/demand data. This author believes prices are moving disproportionately at the whim of speculators. On an hourly basis, WTI continues to be overbought.


