La Croix Energy Capital | Petroleum Derivative Trading

“Think like a fundamentalist; trade like a chartist.”
Dennis Gartman. Rule #8 - Gartman’s Simple Rules of Trading

Friday, January 29, 2010

NYMEX Crude Oil Price Review

Monthly
Weekly

Zooming out from our usual daily-chart view to monthly and weekly shows that on a monthly basis, the Percent R for WTI has rolled over from an overbought position. The last time this occurred the price move was significant, the risk to the downside at this point is likely ~10/bbl to the 6500-6000 region. However, the weekly continuation chart above suggests that there may be some support at 7000 based on trend line support extended from points 2 through 3. A break below 7000 would be needed to confirm the monthly Percent R signal.

Commodities in the News

Commodities Set for Biggest Drop in 13 Months on Demand Outlook Jan. 29 (Bloomberg) -- Commodities headed for the biggest monthly drop in 13 months on concern that demand may wane as governments seek to control economic growth.

The Standard & Poor’s GSCI Index of 24 raw materials is down 5.9 percent this month, the most since December 2008, led by slides of 16 percent for zinc and 14 percent for lead. Copper has lost 7.3 percent this month, also the most in 13 months, and crude oil is down 6.4 percent, the first decline since July. Sugar, feeder cattle and platinum climbed.

Read more: http://www.bloomberg.com/apps/news?pid=20601087&sid=a09v4sL79_Ok&pos=3

Thursday, January 28, 2010

EIA Weekly Natural Gas Stocks Report 22-Jan-10

Summary
"Working gas in storage was 2,521 Bcf as of Friday, January 22, 2010, according to EIA estimates. This represents a net decline of 86 Bcf from the previous week. Stocks were 120 Bcf higher than last year at this time and 87 Bcf above the 5-year average of 2,434 Bcf. In the East Region, stocks were 14 Bcf below the 5-year average following net withdrawals of 67 Bcf. Stocks in the Producing Region were 42 Bcf above the 5-year average of 765 Bcf after a net withdrawal of 3 Bcf. Stocks in the West Region were 60 Bcf above the 5-year average after a net drawdown of 16 Bcf. At 2,521 Bcf, total working gas is within the 5-year historical range."

Source: U.S. Energy Information Administration; NOAA

Wednesday, January 27, 2010

NYMEX Crude Oil Intra-day Price Profiles

60 Minute Intra-day
5 Minute Intra-day The top chart above shows clearly how 7400 provided consistent support from late Fri through to early trading today. Even after the EIA data was released, that support level held firm, giving market momentum to bounce to 7500 resistence. However, at that point there was little motivation for the buy side to push price higher: the EIA products data were bearish; equities were weak; and the USD was strong. When price reached 7400 support for a second time today it lingered only 10 minutes before trading off strongly. Although price did retrace 2/3 of the breakout lower, expect 7400 to now represent new resistence.

EIA Weekly Petroleum Status Report 22-Jan-10

Stocks mmbbls
Crude: 326.7 (-3.9)
- Cushing: 33.0 (-0.7)
Gasoline: 229.4 (+2.0)
Distillates: 157.5 (+0.4)
Total Products: 718.6 (-1.8)

Supplied (Implied Demand) mmbbls/d
Gasoline: 8.6 (n/c)
Distillates: 3.7 (-0.1)
Total Products: 18.9 (+0.1)

Refinery Utilization: 78.45% (+0.07)
Source: U.S. Energy Information Administration

Equities in the News

S&P 500 Is on ‘Precipice,’ May Extend Drop: Technical Analysis
Jan. 27 (Bloomberg) -- The Standard & Poor’s 500 Index may extend its decline from the peak of the rally to 9.6 percent if a key support level is breached, according to the head of technical analysis at Mint Equities Ltd.

The S&P 500 closed at 1,092.17 yesterday, 5 percent below the 15-month high of 1,150.23 on Jan. 19. If the benchmark gauge for U.S. equities breaches the level at 1,087 to 1,091, the next support is at 1,040, 4.8 percent below yesterday’s close, according to Mint’s Geoff Wilkinson.

Read more: http://www.bloomberg.com/apps/news?pid=20603037&sid=aulBQGy08VKs

Tuesday, January 26, 2010

API Stocks 22-Jan-10

mmbbls
Crude: -2.2 (vs. +1.4 fcst)
Gasoline: +0.9 (vs. +1.1 fcst)
Distillate: -2.0 (vs. -1.7 fcst)

NEW YORK, Jan 26 (Reuters) - U.S. crude oil futures stayed lower in post-settlement trading on Tuesday despite industry data showing a surprise drawdown in crude inventories last week.

Heating oil futures pared losses as total distillate stocks fell below forecast, data from the American Petroleum Institute showed, even though its heating oil component was up slightly.

Gasoline futures also trimmed losses, with the API data showing a smaller-than-expected stock build.

"Crude stocks are down with imports lower probably due to weather-related disruptions that slowed offloading of imports in the Gulf Coast last week," said Phil Flynn, analyst at PFGBest Research in Chicago.

Technical View

The Mar10 WTI contract has completed a (slouchy elongated) Head & Shoulder formation on the daily chart. The risk implied in this trading pattern is bearish, if it is followed through. A break below 7400 suggests a remarkable move lower, targeting 6400 region. To negate the bearish view, a break and close above 7600 would be needed.

Banking in the News

Goldman Sachs, in cross hairs, mulls options
Jan. 25 NEW YORK (Reuters) - Goldman Sachs Group might be the most vulnerable U.S. bank under President Barack Obama's proposals to crack down on Wall Street.

If Obama's "Volcker plan" were enacted, Goldman could be forced to explore a range of drastic measures, including spinning off key businesses, returning its bank charter -- or even taking the firm private.
Read more: http://www.reuters.com/article/idUSTRE60P0JW20100126

Other reading: Banks’ exposure to the Obama Plan
http://blogs.reuters.com/great-debate/2010/01/25/banks-exposure-to-the-obama-plan/

Sunday, January 24, 2010

Trading in the News

SEC May Approve Restrictions on Short Sales When Stocks PlungeJan. 23 (Bloomberg) -- Concern that short-sellers accelerate stock declines may prompt the Securities and Exchange Commission to adopt a rule next month aimed at curbing bearish bets when equities are plunging.

The regulation would require the trades be executed above the best existing bid in the market when shares fall 10 percent in a day, said Brian Hyndman, the senior vice president in transaction services at Nasdaq OMX Group Inc.

Friday, January 22, 2010

Weekly Price Review

This week WTI traded a Three Black Crows candlestick formation Wed thru Fri, after trading a head-fake bull trap on Tue. Price action suggests more weakness in the week ahead, but possibly not as aggressive as this week, 7200 should provide some support. If this level is broken, then ~6900 represents next significant support. Care should be take on the bearish side short-term though. The USDX actually closed marginally lower on Fri, which is not entirely supportive of the bearish view for equities and commodities. Technically, while there may be room for more downside on WTI, the Percent R oscillator is indicating an oversold condition, suggesting a pause/reversal near-term is likely. Trader commentary noted that equities volume last week did rise relatively with the fall in prices, but not enough to suggest a massive correction is underway - yet.

A return of 'normal' winter weather to the US NE has lifted HH from 540 support through recent 580 resistance. Another large draw on inventory levels last week has placed stocks well back within the five-year range. Seasonally, the market is beyond the midpoint of the 2009/10 winter season, so, barring aggressive extended cold weather, any price rises should be transitory, with traders/analysts estimating what stock levels will be at the end of this heating season - providing either a bearish or bullish skew, depending on stock forecasts. 600 should represent moderate to significant near-term price resistance.

CBOE Volatility Index 22-Jan-10

Not surprisingly, the VIX has increased this week with the fall in equities. What is remarkable, however, is the extent to which it has risen from Tue to Fri: +9.73 points (+55.3%) from 17.58 to 27.31. Also, Friday closed above the rolling 200 day average. To put this in context, the five year (2005-09) average is 21.6, and in the years prior to 2008, during which the VIX spiked to over 80, the average was ~15. The underlying for the VIX, the S&P500, this week has fallen 58.47 points (-5.1%) from 1150.23 to 1091.76.

Needless to say, fear is back in the market and the relative cost to protect against downside volatility has risen accordingly, if not exponentially.
Source: Chicago Board Options Exchange

CFTC Commitment of Traders 19-Jan-10

Source: U.S. Commodity Futures Trading Commission

Baker Hughes N.A. Rotary Rig Count 22-Jan-10

North American land-based active rigs.
Source: Baker Hughes, Inc.

Thursday, January 21, 2010

NYMEX Crude Oil & Natgas Intra-day Profiles

Not much to say in the way of clever commentary with respect to the WTI price action today. The market worry regarding China's too hot economy is driving a flight to safe-haven currencies and treasuries resulting from a collapse in risk appetite for equities and commodities; plus yesterday's bearish API stocks report; plus today's announcement of Obama's intent to take on Wall Street's banks; plus today's EIA weekly report confirming the bearish API report really left traders with only one trade - sell. Support levels were feable at best, seemingly representing short term pauses for the market to reload and then sell off more. In broad terms, 7600 represents last support of any real strength, after which this author sees nothing until 6900. Beyond 6900? There was one commentary this week suggesting a 40-handle is back on the radar; and a few weeks ago another was warning of south of Mar-09 lows. The Chinese economy could be the event that triggers the long called-for double dip. The stronger the USD, the higher the risk to equities and commodities.

The regional nature of the natgas market was quite apparent today - with the rest of the world falling apart, the Henry Hub market went sideways in a very hohum manner, well entrenched in the choppy range trade of the past few weeks: 580 resistence by 540 support. While the front contract did close up 0.119 on the day, that move was all prior to the stock number coming out this AM. In fact, the day closed only ~0.02 higher than just prior to the EIA release. There was a 0.23 swing in between, but by the end of the day that was all considered noise.

Exploration in the News

Exxon, XTO Chiefs Defend Fracking On Capitol Hill
Jan.20 WASHINGTON (WSJ) -- The heads of Exxon Mobil Corp. and XTO Energy Inc. will tell Congress Wednesday that a controversial gas drilling technique known as "fracking" is safe, in an effort to dissuade lawmakers from interfering with Exxon's planned acquisition of XTO.

Exxon Chief Executive Rex Tillerson will say that "we can now find and produce unconventional natural gas supplies miles below the surface in a safe, efficient and environmentally responsible manner," according to prepared testimony.
Read more: http://online.wsj.com/article/SB10001424052748704320104575015030370532948.html

EIA Weekly Petroleum Status Report 15-Jan-10

Stocks mmbbls
Crude: 330.6 (-0.5)
- Cushing: 33.7 (-0.7)
Gasoline: 227.4 (+3.9)
Distillates: 157.1 (-3.3)
Total Products: 720.4 (-1.1)

Supplied (Implied Demand) mmbbls/d
Gasoline: 8.6 (-0.1)
Distillates: 3.8 (+0.2)
Total Products: 18.7 (+0.1)

Refinery Utilization: 78.38% (-2.92)
Source: U.S. Energy Information Administration

EIA Weekly Natural Gas Stock Report 15-Jan-10

Summary
"Working gas in storage was 2,607 Bcf as of Friday, January 15, 2010, according to EIA estimates. This represents a net decline of 245 Bcf from the previous week. Stocks were 22 Bcf higher than last year at this time and 6 Bcf below the 5-year average of 2,613 Bcf. In the East Region, stocks were 56 Bcf below the 5-year average following net withdrawals of 131 Bcf. Stocks in the Producing Region were 5 Bcf below the 5-year average of 815 Bcf after a net withdrawal of 96 Bcf. Stocks in the West Region were 55 Bcf above the 5-year average after a net drawdown of 18 Bcf. At 2,607 Bcf, total working gas is within the 5-year historical range."

Source: U.S. Energy Information Administration; NOAA

API Stocks 15-Jan-10

mmbbls
Crude: -1.8 (vs. +2.4 fcst)
Gasoline: +0.7 (vs. +1.9 fcst)
Distillate: -3.4 (vs. -0.1 fcst)

Jan.21 (Reuters) In the U.S., an unexpected drop in crude stockpiles shown by an industry report had little impact on prices. The American Petroleum Institute (API) said inventories fell 1.8 million barrels last week against forecasts for a 2.4 million gain.

The nation's distillate inventories, which include heating and diesel, dropped a larger-than-expected 3.4 million barrels. Supplies were forecast to have slid by 100,000 barrels, a Reuters survey showed.

Inventory data from the government's Energy Information Administration (EIA) will be published on Thursday at 1600 GMT. Both weekly reports were delayed by a day because of a U.S. holiday on Monday.

Wednesday, January 20, 2010

Banking in the News

Obama to Propose Limits on Risks Taken by Banks

Jan.20 WASHINGTON (NYTimes) — President Obama on Thursday will publicly propose giving bank regulators the power to limit the size of the nation’s largest banks and the scope of their risk-taking activities, an administration official said late Wednesday.

The president, for the first time, will throw his weight behind an approach long championed by Paul A. Volcker, former chairman of the Federal Reserve and an adviser to the Obama administration. The proposal will put limits on bank size and prohibit commercial banks from trading for their own accounts — known as proprietary trading.
Read more: http://www.nytimes.com/2010/01/21/business/21volcker.html?hp

Tuesday, January 19, 2010

Energy in the News

Tullow in moves to soothe Ugandan nervesJan.18 (FT) Aidan Heavey, founder and chief executive of Tullow, the UK’s fourth-biggest oil company, says his decision this weekend to pre-empt the $1.35bn (£826m) sale of Heritage Oil’s Uganda assets to Eni, the Italian energy group, was all part of a normal day’s business.

“It’s a normal day ... It’s easy finances,” he says. “Is it a strategic change? No it’s not. It is gaining a better position in a very important asset for Tullow.”

Read more: http://www.ft.com/cms/s/0/d8cd7d60-046e-11df-8603-00144feabdc0.html?ftcamp=rss&nclick_check=1#

Saturday, January 16, 2010

NYMEX Crude Oil & Natgas Price Review

Last week, WTI front month printed an intra-week high of 8395 on Mon; and an intra-week low of 7770 on Fri; closing the week at 7800. As can be seen from the daily candlestick chart above, selling dominated the entire week. Economic news out of China and the week's EIA petroleum report were both bearish factors that helped drive crude prices lower. As we noted last week, 7800 represents reasonable support, however, even though the Percent R oscillator is now indicating a strong oversold reading, the market may drift lower yet to next support level ~7700-7600. The Feb10 contract comes off the board this week after the 20th, so volume in the Mar10 contract will increasingly be more indicative of market sentiment. Monday is a holiday in the US, so trading will be thin tomorrow - and may be volatile as a result.

Watch for consolidation at ~7700-7600, and if this level holds, a reversal higher. A gap opened up between Tue and Wed that the market may try to go back and fill. If the bulls take the market back, a re-test of 8400 could be in play. The Goldman Sachs 2010 forecast of $90 average received a fair amount of media last week, and whether or not markets agree with that outlook, what they say tends to still have an influence on sentiment. Also, the CFTC proposal to control non-commercial participation appears to have been interpreted as moderate, relative to expectations, so this may embolden the bullish skew in the price profile. On the bearish side, U.S. petroleum fundamentals in general continue to be unsupportive. Earnings reporting out of the U.S. over the next weeks will influence views on the strength and rate of recovery of the global economy.

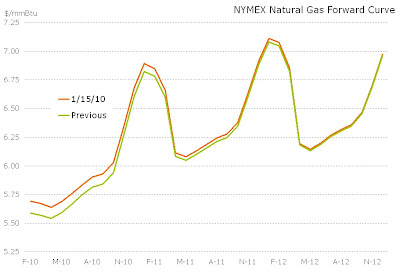
NYMEX natgas put in a range-bound week between 580-540. A large draw on U.S. stock levels was bullish, but was overwhelmed by above normal weather temperatures and a forecast that indicates more of the same. The technical price profile suggests a bearish pennant is in development, implying that a significant test of 540 support could be in play in the near term. On the bullish side, a return to even 'normal' winter weather will provide support, and a return to above normal cold could take the front of the curve back to 600. Inventory levels are now back to within the five year range, albeit they remain above the five year average and last year's level.

Friday, January 15, 2010

Trading (Lifestyle) in the News

Trading-Pit Glamour Dims as Computers Ascend in Film
Jan. 15 (Bloomberg) -- Doug Pringle saw punches thrown, blood spilled and fortunes lost during his 17-year career at the Chicago Board of Trade. He misses it, every day.

“The biting of the nose and the fights, sure, when you’re throwing around that kind of money, people tend to lose it sometimes,” said Pringle, 42, who traded corn, soybeans, 10- year Treasury notes and 30-year bonds. “I miss the excitement.”

CFTC Commitment of Traders 12-Jan-10

Source: U.S. Commodity Futures Trading Commission

Energy in the News

Proposal to Set Position Limits in the Energy Futures and Options Markets
Jan-14 -- The Commodity Futures Trading Commission (CFTC) is proposing to set position limits for futures and option contracts in the major energy markets. In addition, the proposal establishes consistent, uniform exemptions for certain swap dealer risk management transactions while maintaining exemptions for bona fide hedging.
Read more: http://www.cftc.gov/ucm/groups/public/@newsroom/documents/file/energyrrulefactsheet.pdf

Baker Hughes N.A. Rotary Rig Count 15-Jan-10

North American land-based active rigs.
Source: Baker Huges, Inc.